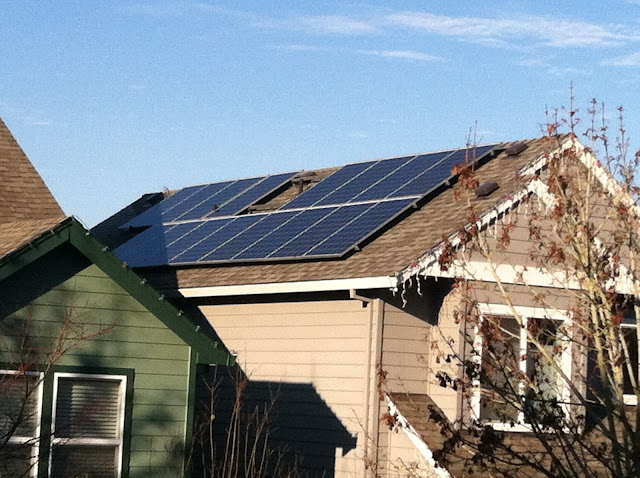
Tracking our home Solar installation process and ongoing information on power generation.
Project Summary
Installing a photovoltaic (PV) system on our home. Our house is 2360 square feet, built in 1999 and has both electric and natural gas utilities. Current electricity use ranges from 900 kWh to 1500 kWh per month, peaking in December… Must be the Christmas lights! The house is situated almost perfectly for solar. Our panels will be on a 33 degree roof that faces almost directly south and with no possible obstructions.
I have been researching Solar PV for our home for number of years and weighing the system costs, available incentives and taxes breaks to what I thought we could afford. With costs at $6.00 to $8.00/watt, I was struggling with REALLY wanting to do this and the practical side of family finances. This last spring I became aware, though my brother, of a Solarize Community project being sponsored by Nike Beaverton, Oregon for employees, friends and family. They had selected a contractor, set a system price of $5/watt and my brother works at Nike… so I couldn’t resist!
System Stats:
Solar System Size: 3.76 kW
2 x Strings of eight SolarWorld 235W panels
1 x 3000KW PV Powered inverter
Portland General Electric (PGE) Net Metering program
Online monitoring module to evaluate solar system output, usage, feed to the grid, etc
Saturday, February 11, 2012
Five Months and Counting
Also as interesting has been to observer when energy is generated on overcast and even rainy days. On your average gray, overcast and drizzly Portland day, I see a couple hundred watts being generated at times.
I have been tracking all the solar generation and overall consumption number for the household and put them into the graph below. You can see the obvious increase in overall consumption (+ XMAS lights...) and decrease in generation as the days get shorter. We've yet to have net-zero month of curse, but we remain hope for the coming summer!

